

A renovation’s payback depends on cash flow, not simply on when construction ends. An office renovation ROI calculator for CFOs compares total project costs with expected benefits, such as operating savings and revenue gains. Payback occurs when cumulative net benefits recover the initial investment.
The calculation is useful only when its assumptions are clear. Construction costs, workplace disruption, the timing of savings, and the value assigned to efficiency or revenue improvements can all affect the result.
This guide explains how to set the inputs, calculate ROI and payback timing, and test how the result changes when costs, benefits, or schedules shift. You’ll have a clearer basis for comparing scenarios and presenting the investment case to decision-makers.
Key Takeaways
- Model project costs and benefits with clear assumptions so you can see which changes have the greatest effect on the investment case.
- Estimate payback from cumulative net cash flow, accounting for when savings and revenue gains are expected to begin.
- Separate measurable financial returns from workplace and strategic benefits to keep the business case transparent.
- Use consistent inputs for project scope, timing, tax treatment, and analysis horizon when comparing renovation scenarios.
- Connect operational goals to construction planning to assess whether the proposed improvements support the way your workplace needs to function.
Sensitivity analysis for costs, benefits, and schedule delays
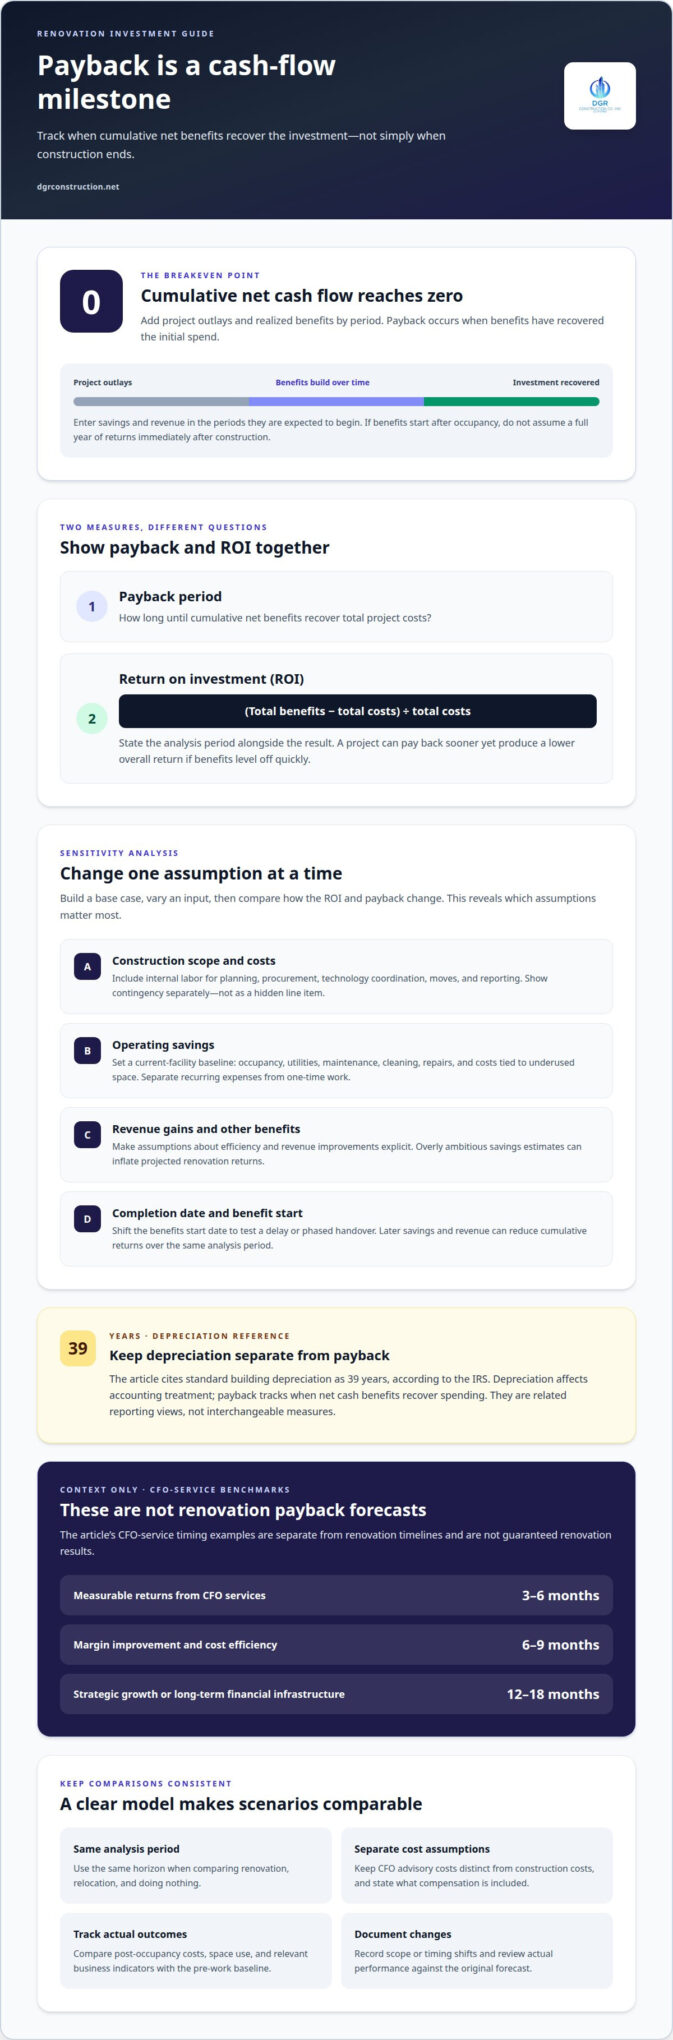
Sensitivity analysis shows how the investment case changes when an assumption shifts. Build a base case, then vary one input at a time: construction scope, operating savings, revenue gains, or completion date. Comparing scenarios reveals which assumptions have the greatest effect on ROI and payback, instead of relying on a single forecast.
Include internal labor in project costs, even when payroll continues during construction. Track employee time spent on planning, procurement, technology coordination, moves, and reporting. Estimate the hours for each workstream and multiply them by the organization’s loaded labor cost. Show contingency as a separate assumption, not a hidden line item, so decision-makers can see its effect on total cost.
Set a baseline for the current facility before estimating savings. Gather lease or occupancy costs, utilities, maintenance, cleaning, repairs, and expenses tied to underused space. Separate recurring expenses from one-time work, then model future cost escalation using the organization’s assumptions. Higher escalation can increase the projected cost of doing nothing, while overly ambitious savings estimates can inflate renovation returns.
Keep CFO advisory costs separate from construction costs. These are different comparison assumptions, not renovation prices. State whether the financial model includes salary, benefits, bonuses, or other compensation.
For asset planning, the calculator describes standard building depreciation as 39 years, according to the Internal Revenue Service. Keep depreciation separate from project cash flow: it affects accounting treatment, while payback analysis tracks when net cash benefits recover spending. Finance teams can align both views in reporting without treating them as interchangeable.
How do office renovation ROI benchmarks compare with relocating or doing nothing? Compare all three options over the same analysis period, including moving costs, ongoing facility expenses, disruption, and expected operating benefits. Doing nothing may preserve current costs, while relocation can replace renovation spending with lease and transition costs.
How do building codes, ADA requirements, permits, and local rules affect office renovation costs? The impact depends on project scope, building conditions, and applicable local requirements. Include design coordination, documentation, permit-related work, and schedule effects in the estimate rather than treating compliance as an afterthought.
Test schedule delays by shifting the benefits start date while keeping other inputs unchanged. A delayed opening or phased handover can postpone savings and revenue, reducing cumulative returns over the same period. Record the revised completion date and rerun the model. The difference between scenarios shows the financial impact of timing.
Breakeven and payback timelines
Payback identifies when cumulative project benefits recover the initial investment. Forecasting that point requires tracking timing, not just comparing annual totals.
CFO Investment Payback Periods
CFO investment payback periods vary with the work being funded. Businesses may begin seeing measurable returns from CFO services within 3-6 months, while margin improvement and cost-efficiency returns may appear within 6-9 months. Strategic growth initiatives or long-term financial infrastructure work may take 12-18 months to pay back. These are CFO-service benchmarks, not guaranteed renovation timelines.
For renovation decisions, distinguish the construction investment from any separate finance engagement. Set a start date for benefits, then map expected savings and revenue gains by period. This makes it easier to compare cash recovery with the time needed for operational changes to take effect.
Payback Period and Project ROI
The payback period measures how long cumulative net benefits take to recover total project costs. ROI measures the relationship between total benefits and total costs over the selected analysis period. A project may reach payback sooner yet deliver a lower overall return if its benefits level off quickly.
Show both measures in the investment case. Use consistent definitions for costs and benefits, and identify when each benefit begins. For a phased renovation, model the operating impact of each completed area separately. This helps owners see whether early phases contribute to breakeven before later work is complete.
To measure post-renovation outcomes, record baseline figures before work begins, then compare them with actual operating costs, space use, and revenue indicators after occupancy. Review results against the original forecast at regular intervals, and document scope or timing changes that explain any variance.
Build a cash-flow schedule showing project outlays and realized benefits by period. Payback occurs when cumulative net cash flow reaches zero. If benefits begin only after occupancy, enter them in the relevant periods rather than assuming a full year of savings immediately after construction. This avoids overstating early returns.
To calculate ROI, subtract total costs from total benefits, then divide the difference by total costs. Use the same analysis period when comparing alternatives. A longer horizon may capture continuing efficiency gains, while a shorter view emphasizes near-term cash recovery. State the chosen period alongside the result so decision-makers understand its limits.
Post-completion reporting should pair financial results with operational measures tied to the project’s purpose. Track utility and maintenance spending for cost goals, and use relevant workplace or business indicators for productivity and revenue objectives. Compare actual performance with the baseline, account for changes in occupancy or business activity, and revise forecasts when evidence points to a different trend.
For a renovation involving phased work, practical construction planning can help align project milestones with the timing assumptions in the financial model.
Efficiency savings and revenue gains
Model efficiency savings and revenue gains as separate benefit streams. This shows decision-makers whether an office renovation improves operating costs, supports growth, or does both. Start with the business purpose of each proposed change, then connect it to a measurable financial indicator. For example, a redesigned team area should have a defined operational goal before its projected benefit enters the forecast.
For savings, identify expenses the project could affect and establish their current baseline. Relevant categories may include utilities, maintenance, cleaning, and costs associated with inefficient space use. Link each expected reduction to a clear mechanism: an upgraded system may change energy consumption, while a different layout may reduce underused space. Record the baseline period and calculation method so future reporting uses the same basis.
Distinguish recurring savings from one-time reductions. A recurring operating expense reduction can generate benefits across multiple periods, while a one-time avoided cost belongs only in the period when it occurs. List each benefit’s start date, duration, and operational dependency in the model. If a projected saving depends on occupancy, operating hours, or a new process, state that dependency beside the figure.
Revenue gains need an equally clear rationale. Identify how the renovated workplace could support business operations, such as accommodating more capacity, improving client-facing space, or enabling a different workflow. Connect that change to a revenue measure the company already tracks. Separate revenue from margin: incremental sales are not the same as profit retained after associated costs.
A hypothetical distributor example assumes full run-rate benefits of $230,000 per year. Use this as a modeling illustration, not an expected office-renovation result. To adapt the method, identify the operational change behind the benefit, estimate when it reaches full run rate, and phase the forecast rather than entering the full annual amount immediately. That approach makes timing assumptions visible to owners.
- Efficiency: Link each proposed change to an expense category and baseline.
- Revenue: Connect the operational improvement to a tracked business measure.
- Timing: Show when each benefit starts and when it reaches its modeled level.
- Attribution: Separate renovation effects from unrelated business growth.
Before approving the investment, test a lower-benefit scenario alongside the base forecast. Reduce one benefit assumption at a time, such as the share of savings attributable to the renovation, and compare the resulting cash flow. Keep the project’s operational purpose visible in each scenario. This reveals which assumptions drive the decision and where post-occupancy measurement should focus.
After completion, compare actual results with the baseline using consistent definitions. If utility savings appear but revenue does not change, report those outcomes separately rather than combining them into one success measure. A structured review helps finance and operations teams update forecasts, explain variances, and determine whether the renovation is fulfilling its intended purpose.
Renovation ROI calculator inputs
An office renovation ROI calculator for CFOs is most useful when each input connects project scope to cash flow over a defined analysis period. Separate construction spending, tax effects, operating savings, and residual value to make assumptions clear.
Tax Credit and Deduction Inputs
Tax inputs should reflect the project, business entity, and applicable federal, state, or local rules. Model each relevant credit or deduction as its own line, with its expected timing, rather than blending it into operating savings.
The calculator displays an effective tax rate of 21.0% and identifies 21% as the federal corporate rate, according to the Internal Revenue Service. Which credits or deductions apply depends on the work and the business’s eligibility; include applicable items as distinct assumptions in the financial analysis.
Cost per Square Foot Inputs
There is no single cost-per-square-foot input that fits every U.S. office renovation in 2026. Scope, existing conditions, finish selections, building systems, and project phasing shape the estimate.
Calculate a project-specific rate by dividing estimated renovation costs by the area included in the work. Keep the scope consistent: do not compare a partial-floor renovation with a whole-building estimate. Record exclusions separately so owners can see what the estimate covers.
Cost and Operating Savings Models
Enter costs in the periods when cash is expected to leave the business. Separate design, construction, equipment, internal labor, and transition expenses, then phase payments according to the project schedule. This timing makes the cash-flow analysis more useful than entering one total in the first period.
For operating savings, define a baseline for each expense and model the expected change by period. Show when savings begin, whether they ramp up, and which operating conditions support them. Compare the base case with a lower-savings scenario to test how sensitive the return is.
Residual Value Modeling
Residual value is the value remaining at the end of the analysis period. Include it only when there is a supportable basis, and state the assumption clearly rather than treating it as an automatic cash payment.
The calculator describes standard building depreciation as 39 years, according to the Internal Revenue Service. Keep that accounting input distinct from residual value and project cash flow. An office renovation ROI calculator for CFOs should show depreciation separately while testing whether benefits continue beyond the final modeled period.
Model costs and savings in the periods when they occur, then show any residual value separately at the end of the analysis period. For an office renovation ROI calculator for CFOs, this timeline makes return assumptions easier to compare across tailored scenarios.
Separating hard, soft, and strategic benefits
Classify each benefit before adding it to the investment case. Hard benefits have a direct financial measure, soft benefits describe workplace outcomes, and strategic benefits support broader business priorities. This distinction helps leadership review cash impacts separately from outcomes that require operational evidence.
Hard benefits can be tied to a verifiable expense or income statement. Examples include reduced utility spending, lower maintenance costs, or increased revenue linked to additional capacity. For each estimate, identify the source record, baseline period, calculation method, and accountable owner. Keep cost reductions separate from revenue growth, because revenue is not the same as retained profit.
Soft benefits include outcomes such as improved collaboration, employee experience, or easier access to shared resources. These may matter to the decision, but should not be entered as cash savings without a defensible conversion method. Instead, define a measure before work begins, such as workspace utilization or employee feedback, and report it alongside financial results.
Strategic benefits connect the project to a longer-term business objective. For example, a layout that supports a new operating model may help leadership accommodate future growth. Describe the intended outcome, affected teams, and operational change required. A strategic benefit is more useful when owners can link it to a decision or business plan.
- Hard: Record direct financial effects, such as an expense reduction, with supporting records.
- Soft: Select a nonfinancial measure, such as employee feedback, and establish its baseline.
- Strategic: Link the outcome to a named business priority and identify its owner.
Prevent double counting by assigning each benefit to one category and one calculation. If improved space use reduces leased area, count the resulting occupancy savings as a hard benefit. Don’t also count the same change as a separate productivity gain unless a distinct measure supports that additional effect. This discipline keeps a complex forecast clear.
For each item, document the estimate, evidence, timing, and person responsible for tracking it. Compare projected results with actual performance after occupancy. If a soft measure improves but financial results do not, report both findings accurately. This record helps leadership determine whether the project delivered operational value, financial return, or both.
Use this classification to shape project requirements before design decisions are final. A commercial renovation plan can connect workplace objectives with scope, sequencing, and measurable outcomes.
ROI from fractional CFO services can include tangible benefits such as cost savings, revenue growth, and efficiency gains, alongside intangible benefits such as stronger financial strategy, risk management, and investor relations.
DGR Construction: Aerospace Construction
DGR Construction Co. provides Aerospace Construction for organizations planning work in aerospace facilities. If your investment case involves facility construction rather than a standard office renovation, align the financial model with operational requirements, project scope, and delivery planning. For commercial space reconfiguration, Tenant Improvement may be a better fit.
These project types require clear coordination between business objectives and construction decisions. Define the intended use of the space, required scope, and outcomes leadership expects to measure. This gives finance and project teams a shared basis for evaluating assumptions and anticipated operational benefits.
To discuss a project, contact DGR Construction Co..
Turn the Investment Case Into a Project Brief
A financial model is most useful when its assumptions guide the next planning decisions. Use the office renovation ROI calculator for CFOs to identify the operational outcomes that matter most, then carry those priorities into a defined project brief. Clear objectives help finance and project teams evaluate scope, phasing, and expected performance against the same business needs.
DGR Construction Co. provides Aerospace Construction, Data Center Construction, and Industrial Construction. For organizations considering a facility project in these areas, the next step is to discuss how operational requirements shape the construction scope. A focused conversation can connect the investment case to practical project planning.
Discuss your project with DGR Construction Co. and move forward with a clearer foundation for planning.
Frequently Asked Questions
How do CFOs calculate ROI for an office renovation?
CFOs calculate renovation ROI by comparing the project’s net financial benefit with its total investment over a defined period. Use a consistent scope, then identify which costs and benefits belong to the renovation rather than normal operations. For example, if a layout change reduces leased space, link the claimed benefit to lease expense actually avoided, not a general productivity estimate. Keep one-time benefits separate from recurring cash effects, and reconcile the model with actual ledger categories after occupancy.
What financial benefits can office renovations deliver, including energy savings and productivity gains?
Renovations can reduce operating expenses or support business performance when they change how space functions. Assess energy savings by comparing utility consumption before and after improvements, while accounting for occupancy and operating hours. Productivity gains need a separate measure, such as workflow completion time or space utilization. For example, a redesigned collaboration area may support teamwork, but its financial value depends on a measurable operational change, not the design feature alone.
What is the payback period and net present value of a typical office renovation?
The payback period is the first point when cumulative net cash flow recovers the project investment. Net present value (NPV) is the present value of future cash flows minus the initial outlay. Calculate both using the same project scope and benefit schedule. NPV also uses a discount rate selected under the company’s financial policy. Together, these measures show cash recovery timing and how projected future returns compare with today’s investment.
What hidden costs and financial risks should CFOs include in an office renovation budget?
Include internal staff time, temporary work arrangements, moving and storage, technology disconnection or setup, commissioning, and costs associated with phased occupancy. These expenses may fall outside the visible construction scope but still affect cash flow or the date operations resume. Model contingency separately, and test schedule slippage or scope changes as distinct scenarios. Assign each risk an owner and record its financial effect so leadership can distinguish planned spending from exposure requiring active oversight.